Module 10: Debate on Explainable ML
Nowadays, deep neural networks are widely used to build machine learning models and AI, and their applications are common in daily life including chatbox, object detection, etc. People want to interpret the black box of the model to understand what those models learn and see. However, people tend to overexplain the association between the result and the model or over-rely on the interpretation method such as model properties or post-hoc interpretation techniques. In this survey, we focus on analyzing several feature attribution based interpretation methods. We would like to discuss how people evaluate those methods and how those methods might mislead people.
Introduction
With the rapid development of machine learning and AI, more and more applications adopt ML and AI. For example, object detection, image classification, image generations, etc. However, the models are a black box to humans. As the dimension and the number of parameters grow insanely to increase the performance, it is hard for a human to realize what the models learn and what the model analyzes and processes. Therefore, people start trying to interpret the model. For example, they try to build the association between the results and the model properties. Post-hoc interpretation techniques are invented to help with the explanation of how the model works. With a better understanding of the models, people believe that they can adjust the model based on the demand. However, the end goal of the interpretation models has no formal definition. Yet we do not know whether the interpretation models actually improve the model’s performance, robustness, or generalization.
In the next section, we go over the issues needed to be solved with the definition and the desiderata of interpretability and a brief introduction to the current interpretation techniques. Since many interpretation techniques are proposed to explain the models, we focus on the analysis of feature attribution based methods, which is one example of post-hoc interpretation, in the following section.
Background
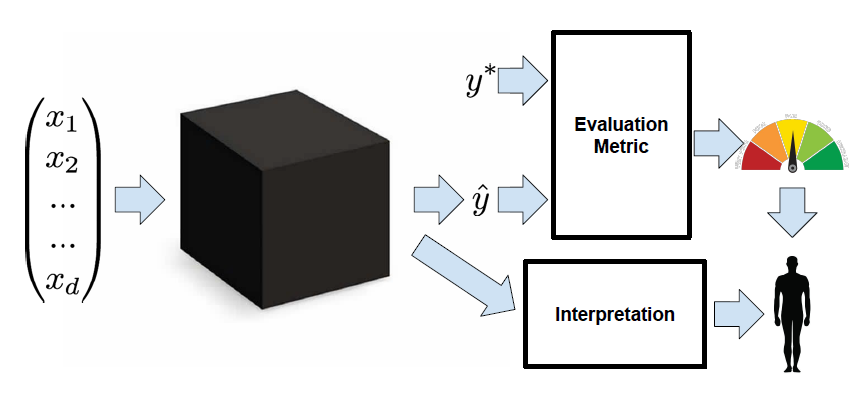
As Lipton [1] mentions in the paper, when interpreting the supervised learning model, people only have two kinds of information, the evaluation metrics and the results of the interpretation techniques (Fig 1). Interpretability is like connecting the model itself and the two types of data, evaluation metrics and the interpretation results. The problem is that the researchers have different desiderata of interpretability. And the definition of interpretability is not well defined in their research.
Kim [2] and Ribeiro et al. [3] claim that “Interpretability is to be prerequisite for trust.” However, they do not define the standard of being able to trust. Some people argue that a sufficiently accurate model is trustworthy, but the examples for the model to decide the correct prediction may not be reliable. For instance, in a crime rate prediction model, the model can accurately predict which community has a higher crime rate, but we cannot account for the racial bias in the train data [1]. It is not only about how often a model is correct, but also about which examples are correct.
Liu et al. try to infer properties or generate hypotheses about the natural world from the associations of the results and the model in their paper [4]. They would like to build the causality between the features of the train data with the results. However, the association does not equal the causality because the train data may not contain all the factors that influence the result as features.
Transferability is another desideratum in interpretability research. Nevertheless, people partition the dataset into training and test data randomly and judge a model’s generalization error by the gap between its performance on training and test data. It is possible that the environment is adversarial, which makes the model predicted completely wrong. We cannot ignore the gap between the training and test data.
People also want the models to provide information to help with decision-making. However, it is hard to define what information is and how we can get the information. In supervised learning, we reduce the error to improve the performance of the model. The accurate results save us time to make decisions, but it lacks the content for humans to think about and analyze.
Goodman and Flaxman [5] propose that the purpose of interpretability is to meet ethical standards, so people can make fair decisions based on the model. Yet the issue of dataset bias and the algorithmic bias are not solved. There is no guarantee for the correctness of the result of the model. People should present clear reasoning based on falsifiable propositions and offer a natural way of contesting these propositions and modifying the decisions appropriately if the results are wrong.
The reasons for the explainable ML are various. People need to work on a formal and universal definition to quantify the interpretability. There are several methods currently used to interpret the ML models. They are divided into two categories. The first one is analyzing the model properties, which is called the transparency of the model. The transparency can be examined from three levels: simulatability (at the level of the entire model), decomposability (at the level of individual components), and algorithmic transparency (at the level of the training algorithm). The basic idea is that if we can contemplate the entire model at once, the model has good simulatability. If we can provide an intuitive explanation of each input, parameter, and calculation, the model gains decomposability. If we can understand the shape of the error surface and prove that the training algorithm will converge at a unique solution even for unseen data, the model achieves algorithmic transparency. However, humans have limited capacity for human cognition. If the models have a large size or lots of layers, it loses simulatability and decomposability. Furthermore, it is hard for people to know how a modern deep learning algorithm works. We cannot even guarantee that the result will converge on new problems. The modern deep learning algorithms lack algorithmic transparency.
Analyzing the transparency of the complex and large model seems to be too hard for humans due to the limited capacity of human cognition. People propose post-hoc interpretations to help explain the model. Instead of directly interpreting the model, we present a separate process for extracting information from learned models. For example, Krening et al. [6] train a model to generate predictions and a separate model to generate an explanation. By doing so, they can map the model’s state representation onto the verbal explanation. Post-hoc interpretability can be visualization. For example, people utilize the saliency map, which highlights the pixels that are relevant for certain image tasks, to interpret what the model catches in each layer. However, post-hoc interpretability can potentially mislead. Since this method still relies on humans to connect the interpretation results to the evaluation metrics, they could optimize the algorithm to present misleading but plausible information.
Feature Attribution Based Methods
A feature attribution method takes model inputs and provides a per-feature attribution score to indicate how much each feature in the model contributed to the prediction. Typically, a positive score implies that the feature contributes to the model’s prediction. Zero means that the feature has no contribution to the prediction. A negative value of the score shows that removing the feature would increase the probability of the predicted class.
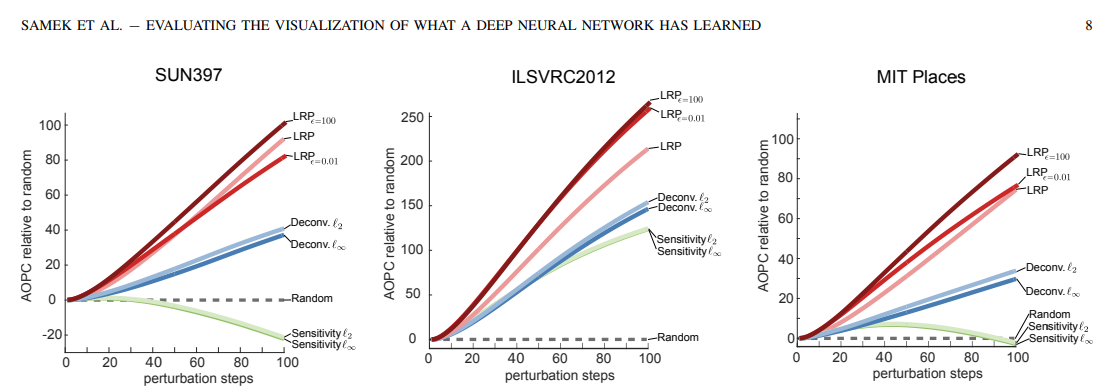
Back in 2017, Samek et al. [7] propose a mask method to evaluate heat maps for color images. They start by ranking the locations on a predefined grid based on the value of the heat map. The ranking also represents the importance of the region with respect to the classification score. Next, they propose MoRF, which replaces all the pixels in neighbors around one particular region by randomly uniform sampled values from the most relevant region to the most irrelevant region. To compare different heat maps, Samek et al. [7] propose to calculate the area over the MoRF perturbation curve (AOPC), because the most relevant regions imply a steep decrease in the MoRF curve, and thus a larger AOPC. After experimenting with the random baseline, sensitivity heatmaps [8], deconvolution heatmaps [9], and relevance heatmaps (LRP) [10] methods, from Fig 2, they conclude that LRP algorithms have the largest AOPC, showing the effectiveness of LRP methods.
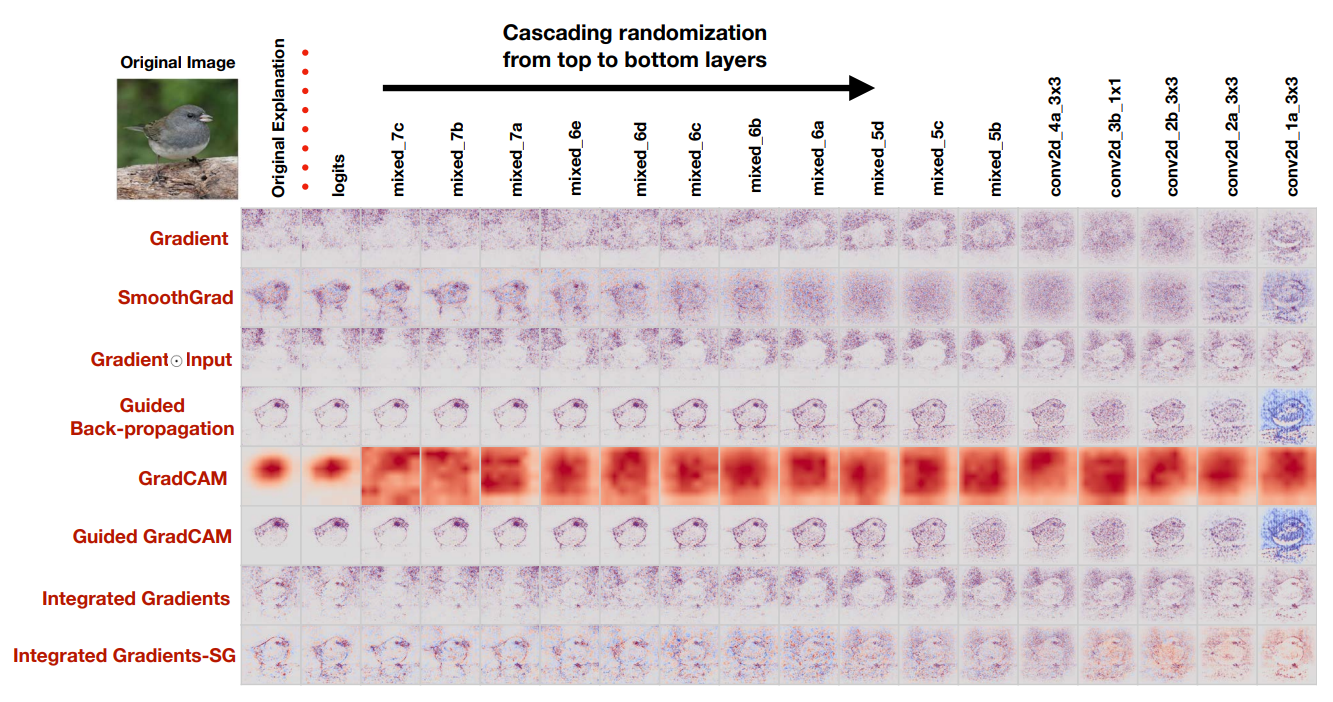
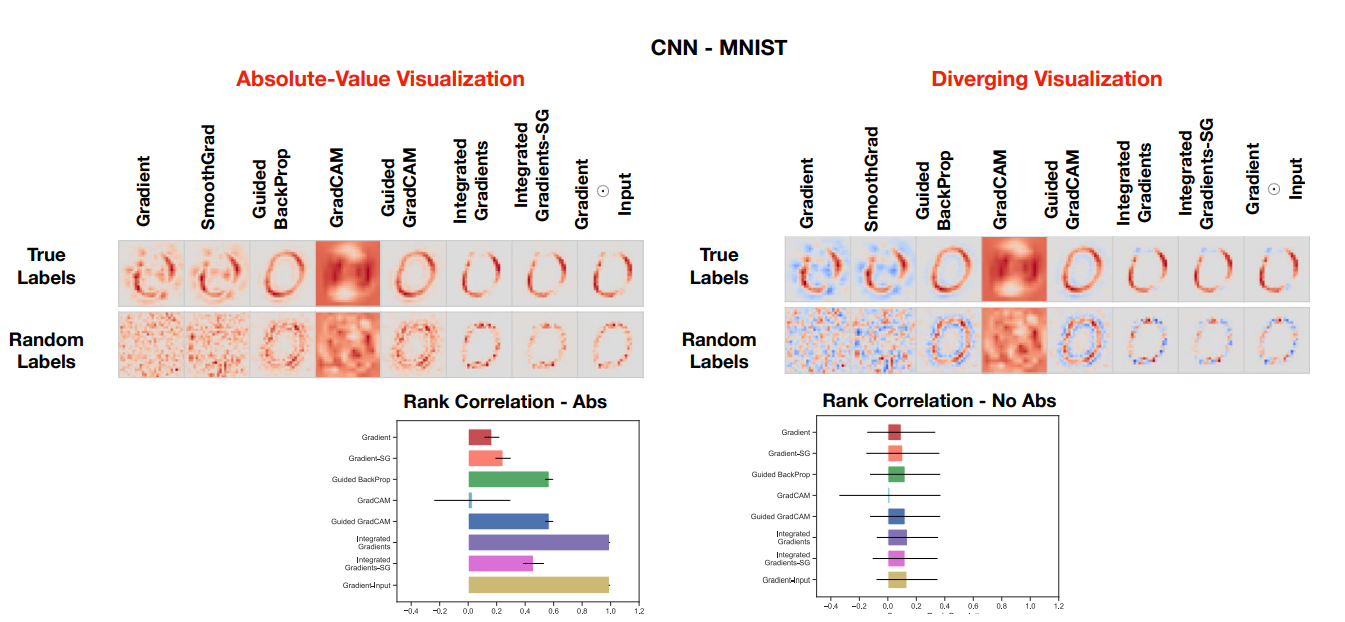
The mask and degradation methods are common in evaluating saliency maps. However, it only considers the saliency method rather than the relationship between the model, training dataset, and the saliency algorithm. Adebayo et al. [11] propose two types of randomization tests to evaluate the effectiveness of saliency methods: the model parameter randomization test, and the data randomization test. The model parameter randomization test fixes the training/test data, model architecture, and hyperparameter settings but randomly initializes one or some model layers. The output of the saliency map is supposed to be different from the original setting, otherwise, this saliency method is considered to be independent of the model. Similarly, the training labels are shuffled in the data randomization test and the tested saliency method is viewed to be invariant to the data generating process if the output saliency map in the randomization test is similar to the original saliency map. From Fig 3 and Fig 4, Adebayo et al. [11] point out that Gradients methods and its variant including GradCAM pass the sanity checks, while Guided BackProp and Guided GradCAM are invariant to higher-layer parameters. This also means some existing methods are inadequate for tasks that require model or data variance, such as finding outliers in data and debugging the model. During the experiments, Adebayo et al. [11] also show that solely relying on visual assessment is misleading, it is more rigorous for researchers to focus on quantitative results, such as Spearman metrics, SSIM, or HOGs similarity metrics. Finally, Adebayo et al. [11] interpret their findings by comparing them to edge detectors. They also prove the effectiveness of their evaluation method in a linear model and a single-layer convolutional neural network.
Though the common strategy to evaluate a saliency map is to remove the informative region and look at the model’s degradation, Hooker et al. [12] mentioned the limitation of this method: without retraining, the training data and testing data are not in the same distribution. Therefore, degradation can also be explained by the distribution shift. To overcome this problem, Hooker et al. [12] propose ROAR: Remove And Retrain. They firstly sort the input dimensions according to the saliency map. For the top fixed fraction of the ordered set, they replace the corresponding pixels in the original image with the per channel mean. Then they generate new train and test datasets based on the percentage of all features modified. Finally, they retrain the model on new train datasets and evaluate it in a new test dataset. After experiments, they show that SmoothGrad-Squared [13] and Vargrad [11] far outperform both the underlying method and a random guess. Additionally, Classic SmoothGrad [13] performs poorly in ROAR.
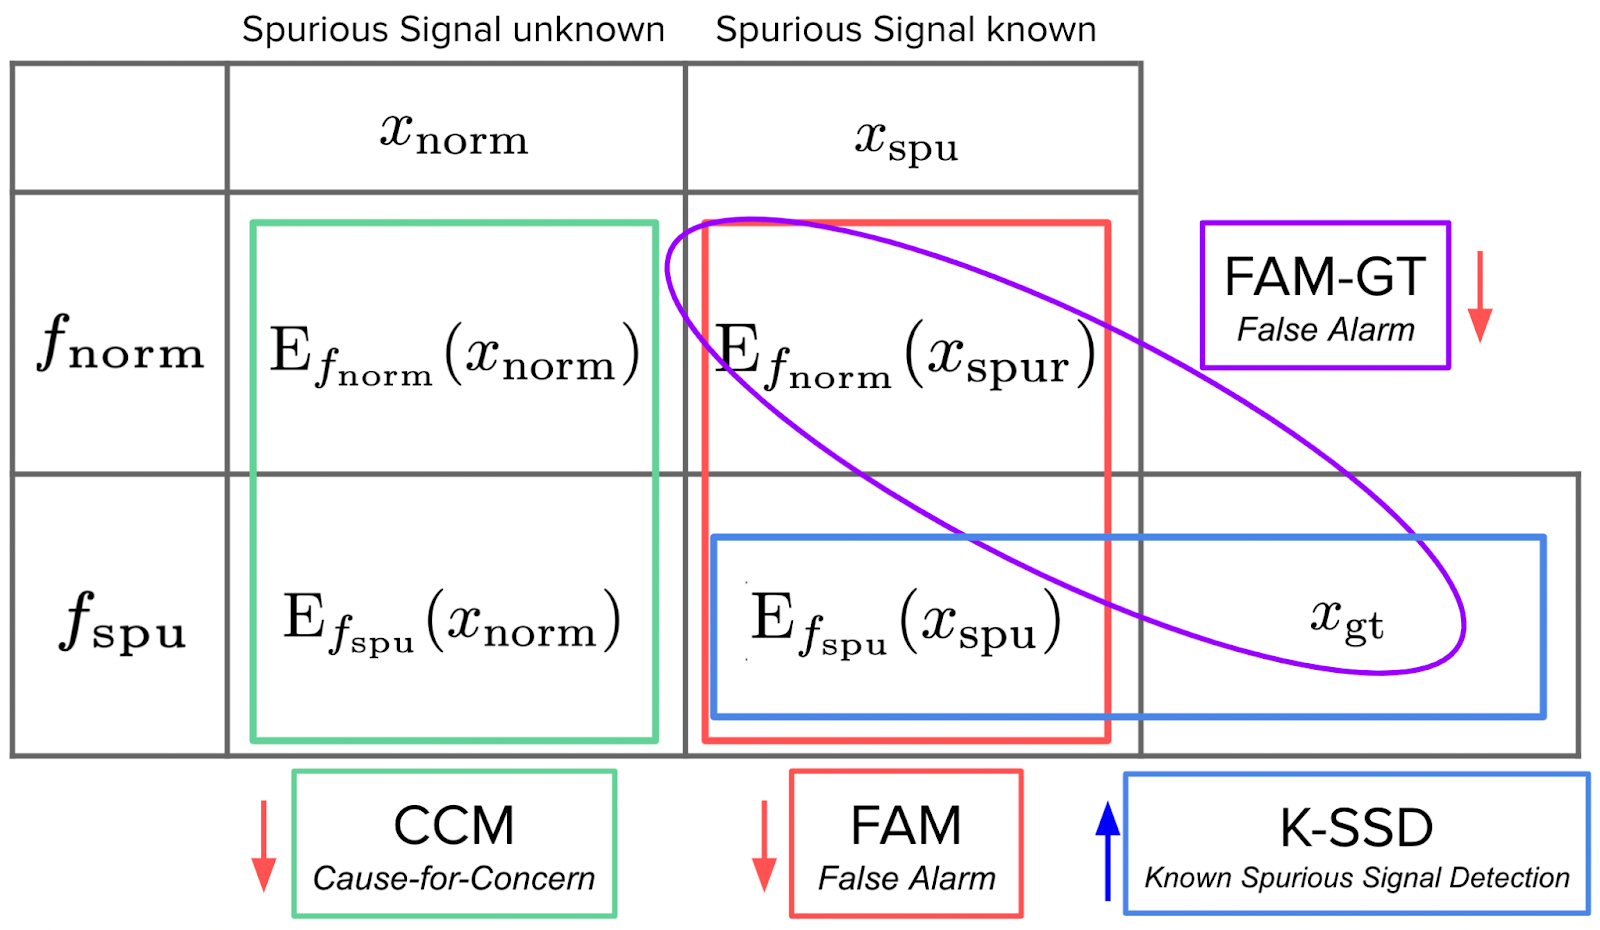
The above evaluation methods focused on the effectiveness of interpretability methods in detecting and explaining model deficiencies. Yet Adebayo et al. [14] focused on another aspect to evaluate: whether these explanations can be used to detect model reliance on spurious signals – robustness. To achieve this goal, they trained two models on inputs with spurious and normal signals respectively: the normal model trained on normal data and the spurious model trained on perturbed data with spurious signals. A feature attribute method sensitive to the model’s reliance on spurious signals should be able to generate different explanations for the normal and spurious models. Adebayo et al. designed three metrics to evaluate such sensitiveness: Known Spurious Signal Detection (K-SSD), Cause-for-Concern (CCM), and False Alarm (FAM) (Fig 5). These metrics demonstrate whether the models can detect differences between the normal and spurious models under different conditions. After examining the feature attribution maps of Gradients, SmoothGrad, Integrated Gradients, and Guided BackProp, It is found that these feature attribution methods do not generate visually significantly different maps for the normal and spurious model given normal or spurious inputs, which means they are not sensitive to models’ reliance to spurious correlations.
Conclusion
In this survey, we discuss the issues that need to be solved when interpreting deep learning models. We emphasize the need for us to work on a formal and universal definition to quantify the interpretability. More importantly, an over-rely on the interpretation method can be misleading. As an example of post-hoc interpretation, feature attribution based methods analyze how much each feature in the model contributed to the prediction. We examine the commonly used strategies to evaluate those methods and how these methods can be ineffective under certain scenarios. It will be more rigorous for researchers to focus on quantitative analysis than solely relying on visualization to interpret deep learning models. Some of the saliency map methods are sensitive to both model parameter and training data, such as gradient and gradient variants, but some methods including Guided BackProp are independent to model parameter and dataset, which is not supposed to be applied to model or data relevant tasks, for example, finding outliers. Finally, some feature attribution methods including Gradients, SmoothGrad, Integrated Gradients, and Guided BackProp, are not sensitive to models’ reliance to spurious correlations.
Reference
[1] Zachary C. Lipton. “The Mythos of Model Interpretability.” 2016.
[2] Kim, Been. “Interactive and interpretable machine learning models for human machine collaboration.” PhD thesis, Massachusetts Institute of Technology. 2015.
[3] Marco Tulio Ribeiro, Sameer Singh, and Carlos Guestrin. "”Why Should I Trust You?”: Explaining the Predictions of Any Classifier.” 2016.
[4] Liu, Changchun, Rani, Pramila, and Sarkar, Nilanjan. “An empirical study of machine learning techniques for affect recognition in human-robot interaction.” In International Conference on Intelligent Robots and Systems. IEEE, 2005.
[5] Bryce Goodman, and Seth Flaxman. “European Union regulations on algorithmic decision-making and a “right to explanation”.” 2016, AI Magazine, Vol 38, No 3, 2017.
[6] S. Krening, B. Harrison, K. M. Feigh, C. L. Isbell, M. Riedl and A. Thomaz. “Learning From Explanations Using Sentiment and Advice in RL.” In IEEE Transactions on Cognitive and Developmental Systems, vol. 9, no. 1, pp. 44-55, March 2017.
[7] Wojciech Samek, Alexander Binder, Grégoire Montavon, Sebastian Bach, and Klaus-Robert Müller. “Evaluating the visualization of what a Deep Neural Network has learned.” 2015.
[8] K. Simonyan, A. Vedaldi, and A. Zisserman. “Deep inside convolutional networks: Visualising image classification models and saliency maps.” In Proc. ICLR Workshop, 2014, pp. 1–8.
[9] M. D. Zeiler and R. Fergus. “Visualizing and understanding convolutional networks.” In Proc. ECCV, 2014, pp. 818–833.
[10] S. Bach, A. Binder, G. Montavon, F. Klauschen, K.-R. Müller, and W. Samek. “On pixel-wise explanations for non-linear classifier decisions by layer-wise relevance propagation.” PLOS ONE, vol. 10, no. 7, p. e0130140, 2015.
[11] Julius Adebayo, Justin Gilmer, Michael Muelly, Ian Goodfellow, Moritz Hardt, and Been Kim. “Sanity Checks for Saliency Maps.” 2018.
[12] Sara Hooker, Dumitru Erhan, Pieter-Jan Kindermans, Been Kim. “A Benchmark for Interpretability Methods in Deep Neural Networks.” 2018.
[13] Daniel Smilkov, Nikhil Thorat, Been Kim, Fernanda Viégas, and Martin Wattenberg. “SmoothGrad: removing noise by adding noise.” 2017.
[14] Adebayo, Julius, Michael Muelly, Harold Abelson, and Been Kim. “Post hoc explanations may be ineffective for detecting unknown spurious correlation.” In International Conference on Learning Representations. 2021.