Module 9: Explainable ML - Topic: Exploring Powerful Interfaces for Explainable AI
While neural networks demonstrate impressive performance across tasks, they make predictions in a black-box way that is hard for humans to understand. To alleviate the issue, researchers have proposed several ways of interpreting the behaviors of neural networks. Visual inspection of the same is also equally important. In the same context, powerful interpretable interfaces have been developed. In this survey, we focus on such interfaces to get a better understanding of what and why our model is learning what it is attempting to learn!
- Understanding Neural Networks Through Deep Visualization
- ACTIVIS: Visual Exploration of Industry-Scale Deep Neural Network Models
- Axiomatic Attribution for Deep Networks
- Inceptionism: Going Deeper into Neural Networks
- Building blocks of interpretability
- Conclusions
- References
Understanding Neural Networks Through Deep Visualization
The paper[6] does build the initial steps towards DNN Feature visualization. We are introduced with two main tools. The first one visualizes the activations produced on each layer of a trained convnet as it processes an image or video. The authors did find an interesting aspect that representations on some layers seem to be surprisingly local.
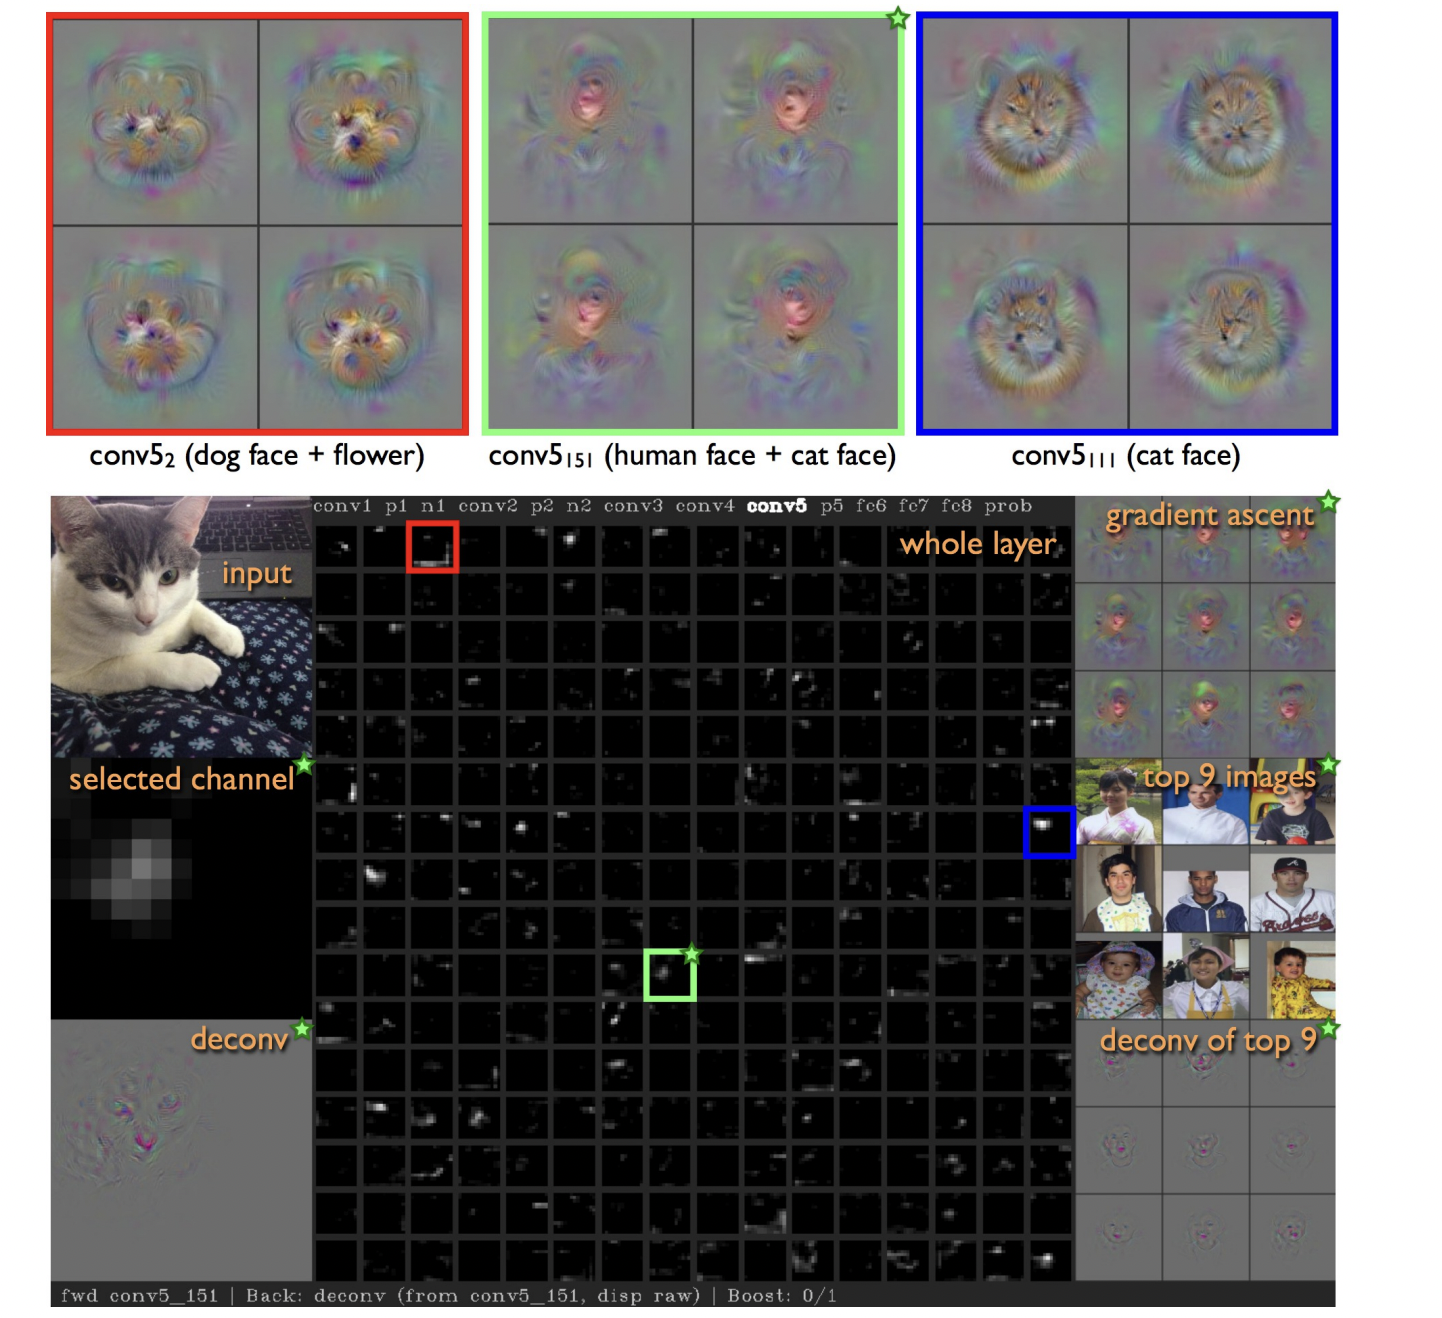
*Fig. Visual look of the system
Secondly, multiple regularization techniques are also introduced to bias images found via optimization toward more visually interpretable examples. While each of these regularization methods helps on its own, in combination they are even more effective. The following four regularizations were investigated: L2 decay, Gaussian blur, Clipping pixels with small norm and Clipping pixels with small contribution. Additionally, a random hyperparameter search was useful for finding joint hyperparameter settings that worked well together.
While the techniques introduced in this paper are surely building blocks for strong interfaces, there is still a lot of scope to improve, especially focus is on only neuron level activation, which might not be enough to get a better picture of interpretability. This issue is resolved by future papers in the survey.
ACTIVIS: Visual Exploration of Industry-Scale Deep Neural Network Models
The paper [4] focuses on how a visual tool can be built especially for large scale dataset which can help in better interpreting deep learning models. It introduces ACTIVIS, an interactive visualization system for interpreting large-scale deep learning models and results which was designed with the help of over 15 researchers and engineers at Facebook. It provides the users with multiple useful views such as computation graph overview of the model architecture, and a neuron activation view for pattern discovery and comparison. This tight integration does give a lot of helpful input to the user.
The diagram below explains the working of ACTIVIS same: As per the paper:
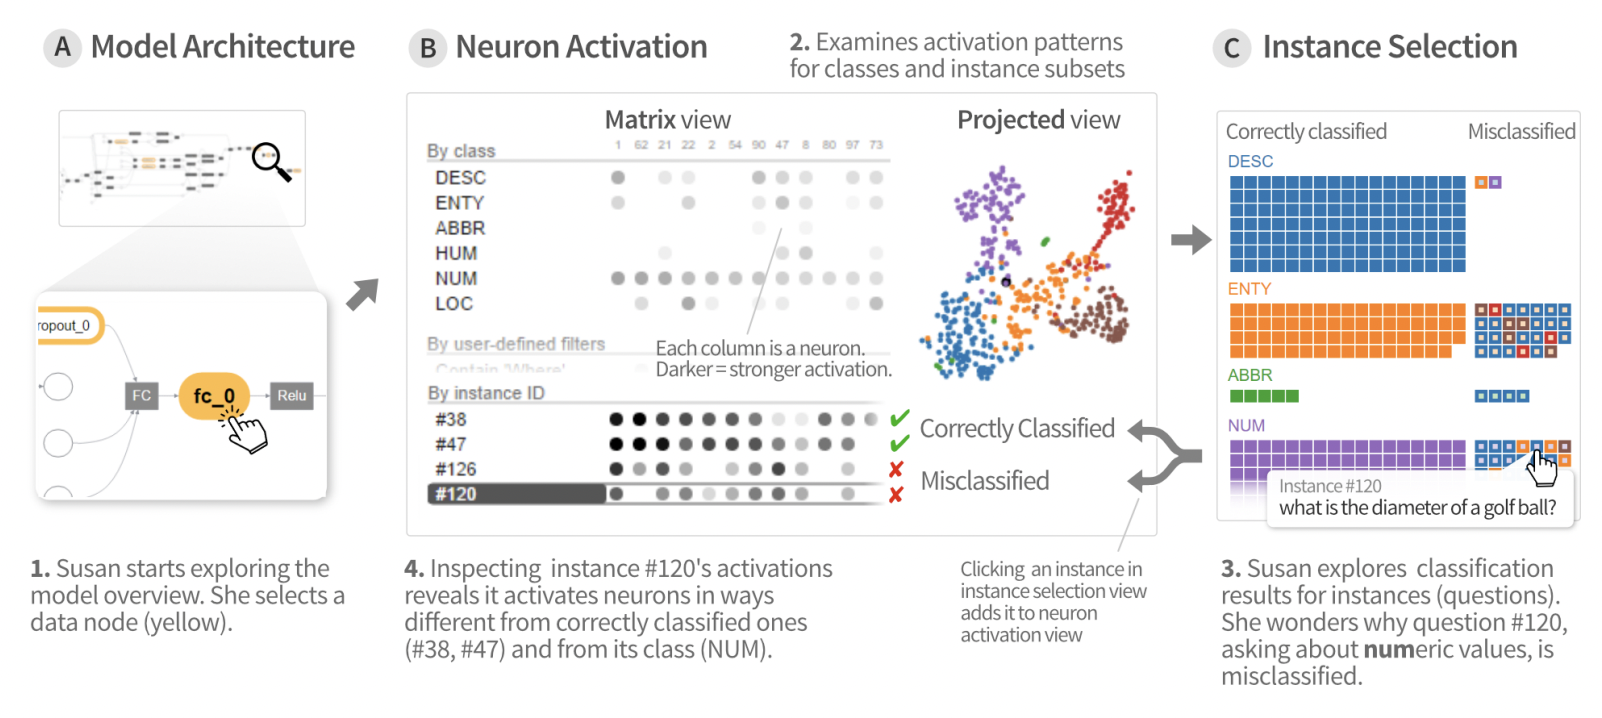
*Fig. Visual look of activis “1. Our user Susan starts exploring the model architecture, through its computation graph overview (at A). Selecting a data node (in yellow) displays its neuron activations (at B). 2. The neuron activation matrix view shows the activations for instances and instance subsets; the projected view displays the 2-D projection of instance activations. 3. From the instance selection panel (at C), she explores individual instances and their classification results. 4. Adding instances to the matrix view enables comparison of activation patterns across instances, subsets, and classes, revealing causes for misclassification”
Activis does look like a really promising option for interpretability interfaces - however faces problems such as lack of gradient visualization which is one main factor for visually understanding the working of models. Additionally, it also needs work on adding Real-time subset definition, automatic discovery of interesting subsets and Supporting input-dependent models.
Axiomatic Attribution for Deep Networks
The paper [5] focuses on attribution and two major axioms - Sensitivity and Implementation Invariance that attribution methods ought to satisfy. The paper shows that these are not satisfied by most known attribution methods, which we consider to be a fundamental weakness of those methods. Using the words directly from the paper - “ The axioms are as follows- An attribution method satisfies Sensitivity(a) if for every input and baseline that differ in one feature but have different predictions then the differing feature should be given a non-zero attribution. Implementation Invariance Two networks are functionally equivalent if their outputs are equal for all inputs, despite having very different implementations. Attribution methods should satisfy Implementation Invariance, i.e., the attributions are always identical for two functionally equivalent networks. To motivate this, notice that attribution can be colloquially defined as assigning the blame (or credit) for the output to the input features. Such a definition does not refer to implementation details.”
The authors introduce a technique called “Integrated Gradients” requires no modification to the original network and is extremely simple to implement. This algorithm is then used to study pixel importance in predictions made by this network. The gradients are computed for the output of the highest-scoring class with respect to pixel of the input image. The baseline input is the black image, i.e., all pixel intensities are zero.
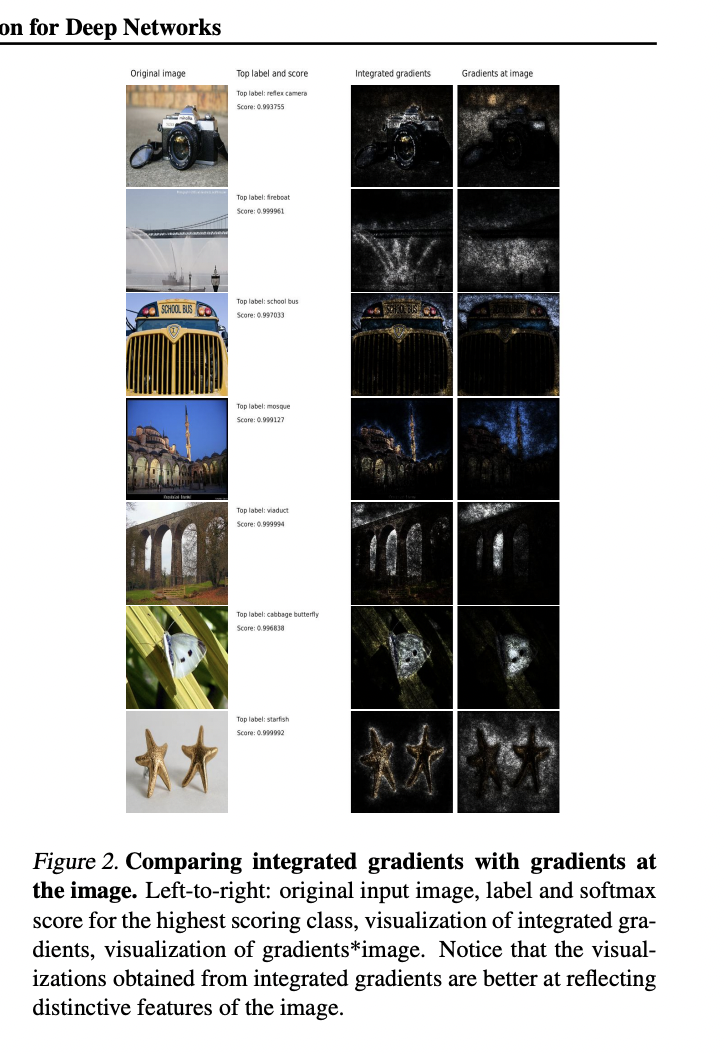
*Fig. Results from integrated gradient. Visualizations obtained from integrated gradients are better at reflecting distinctive features of the image.
The technique specified in the paper is definitely innovative and does clearly show its advantage over existing methods. This technique (although not in stand alone) can be used to get a clearer picture for multiple downstream tasks.
Inceptionism: Going Deeper into Neural Networks
In this paper[3], the authors train an artificial neural network by showing it millions of training examples and gradually adjusting the network parameters until it gives the classifications we want. The network typically consists of 10-30 stacked layers of artificial neurons. Each image is fed into the input layer, which then talks to the next layer, until eventually the “output” layer is reached. The network’s “answer” comes from this final output layer.
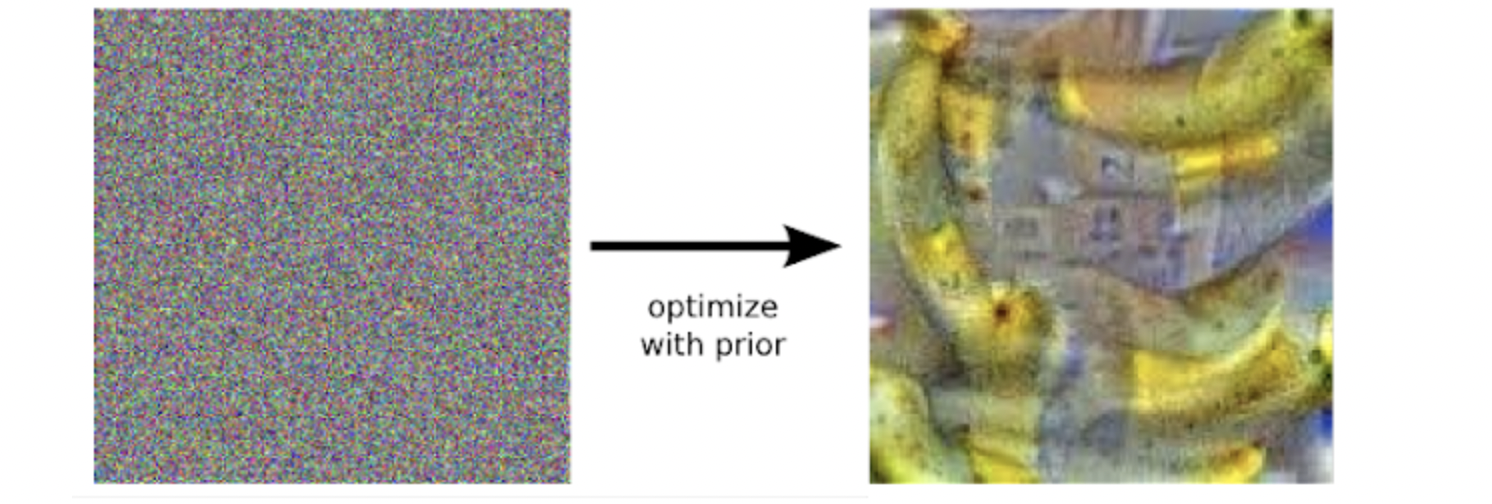
For visualization purposes, “they turn the network upside down and ask it to enhance an input image in such a way as to elicit a particular interpretation.” For example, say you want to know what sort of image would result in “Banana.” Start with an image full of random noise, then gradually tweak the image towards what the neural net considers a banana .
Another important result – in some cases, it is revealed that the neural net isn’t quite looking for the thing we thought it was. For example, here’s what one neural net that was designed for dumbbells but also showed hands.
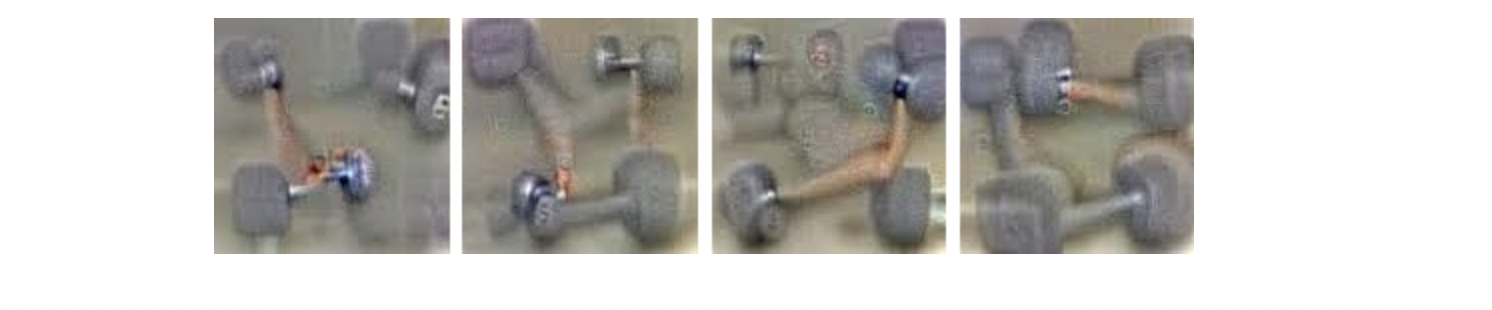
*Fig: Showing the failure of the model
This is a very important paper as this did spearhead visualization research and also introduce optimization objectives. As explained earlier, this approach can be combined with regularizations as well layer and channel attributions to bring about an even better interpretability interfaces.
Building blocks of interpretability
This paper[2] does truly embrace a combination of multiple available techniques to spearhead powerful interfaces.
This paper introduces Semantic dictionaries. The technique is as follows - pair every neuron activation with a visualization of that neuron and sort them by the magnitude of the activation. Activations now map to iconic representations, instead of abstract indices, with many appearing to be similar to salient human ideas, such as “floppy ear,” “dog snout,” or “fur.” In this way, semantic dictionaries are powerful not just because they move away from meaningless indices, but because they express a neural network’s learned abstractions with canonical examples. For instance, GoogLeNet has multiple floppy ear detectors that appear to detect slightly different levels of droopiness, length, and surrounding context to the ears. Now all these techniques can be easily combined to not only see what the network detects at each position, but also what the network understands of the input image as a whole. However, there are manifold problems with this approach - First, it is not clear that individual pixels should be the primary unit of attribution. The meaning of each pixel is extremely entangled with other pixels, is not robust to simple visual transforms (e.g., brightness, contrast, etc.)Also traditional saliency maps are a very limited type of interface — they only display the attribution for a single class at a time.
Next portion, talks about using saliency maps and channel attribution - however there are huge issues with the same too i.e It is Easy to end up with too much information, would take hours to understand the large number of channels that slightly impact the output; secondly, Both techniques are lossy and can miss important parts. Hence, One could avoid loss by working with individual neurons aka not aggregating, but once again defeats the purpose of these techniques.
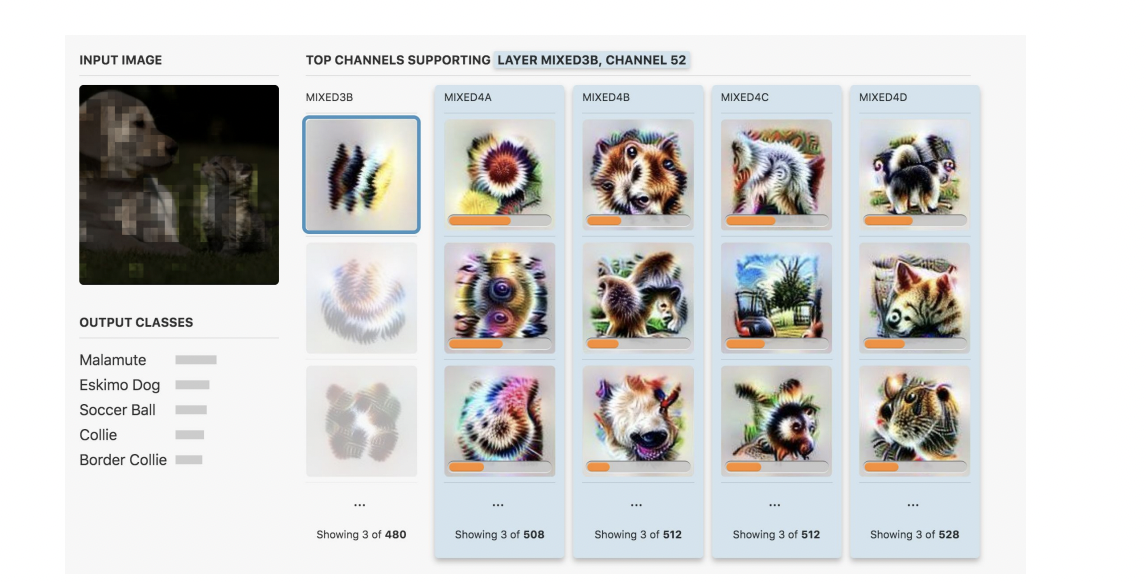
*Fig: Showing how the channel attribution system works
Hence, now the paper introduces another important component called using neuron groups. These neuron groups are created using matrix factorization.
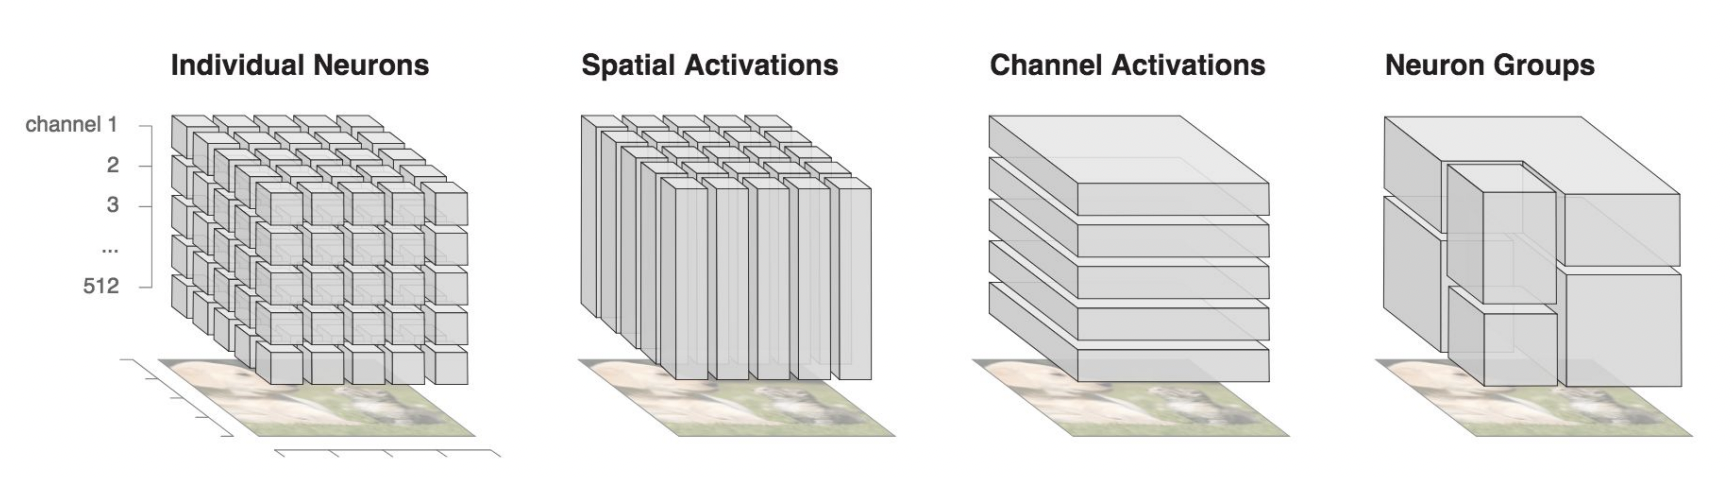
*Fig: Showing the different levels of groupings that can be made
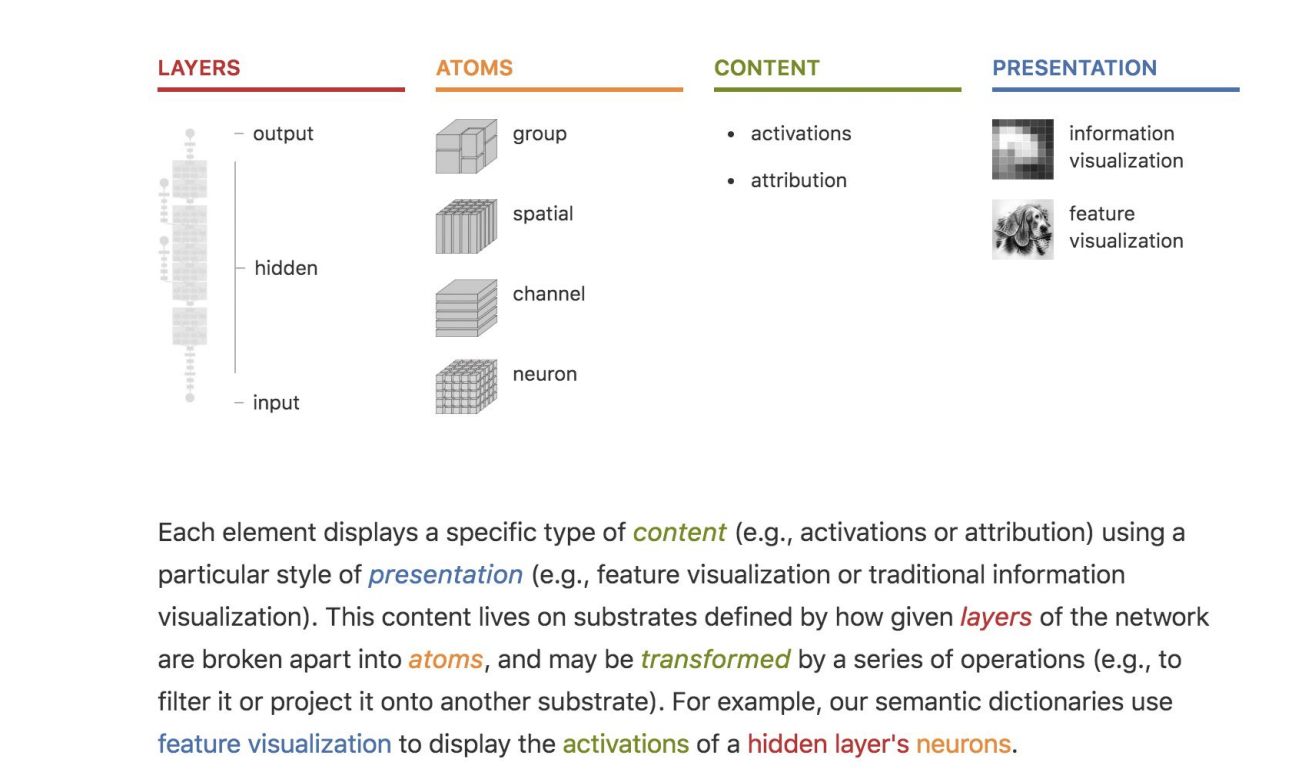
*Fig: The level of granularity that can be built with the system
There is scope for improvement although this is the most powerful out of all the techniques mentioned - Inspect how datasets can influence the model, which datasets caused the furry leg detector to fire, Which data sets caused detectors to increase labrador classification?, Learning from human feedback and making Interfaces for comparing multiple models.
Conclusions
With models being huge and growing even larger day by day building powerful interpretation interfaces is a daunting task especially when one wants to capture everything possible. If we succeed, interpretability promises to be a powerful tool in enabling meaningful human oversight and in building fair, safe, and aligned AI systems.
References
[1] Olah, Chris and Mordvintsev, Alexander and Schubert, Ludwig. “Feature Visualization” In Distill, 2017. https://distill.pub/2017/feature-visualization/
[2] Olah, Chris and Satyanarayan, Arvind and Johnson, Ian and Carter, Shan and Schubert, Ludwig and Ye, Katherine and Mordvintsev, Alexander. In Distill, 2018. https://distill.pub/2018/building-blocks
[3] Mordvintsev, Alexander and Olah, Chris and Tyka, Mike. “Inceptionism: Going Deeper into Neural Networks” In Google Research Blog posts, 2015. https://ai.googleblog.com/2015/06/inceptionism-going-deeper-into-neural.html
[4] Kahng, Minsuk, et al. “A cti v is: Visual exploration of industry-scale deep neural network models.” IEEE transactions on visualization and computer graphics 24.1 (2017): 88-97.
[5] Sundararajan, Mukund, Ankur Taly, and Qiqi Yan. “Axiomatic attribution for deep networks.” International conference on machine learning. PMLR, 2017.
[6] Yosinski, Jason, et al. “Understanding neural networks through deep visualization.” arXiv preprint arXiv:1506.06579 (2015).